This is a free post about the trading methods and concepts I execute on and how I read charts. It is for educational purposes ONLY ! I put some time into it, so at least if anyone finds this helpful in any way, please share/retweet the original link/post with others on Twitter, etc., and maybe they will find it helpful as well.
Also, please give me feedback on Twitter or here about it as well, I am not asking for much ;)
I appreciate it, and I thank you in advance! God bless you all, and happy reading!
To find more information about Subscription and Discord access check out this post if interested:
INTRO
There are zillions of successful trading methods and styles out there traders can find. From long-term investing to mid- and short-term swings to day trading and scalping with stocks, options, futures, etfs, forex, crypto, you name it.
The main thing for every trader is his/her EDGE. I bet there are millions of edges out there that individual traders spot or figure out over the years of their trading journey. The edge is usually probability; the higher the probability, the better, of course. Some traders base their trading concepts on indicators, others on patterns, trendlines, order flow, footprints, supply and demand methods, etc., and some mix several and create "kitchen sinks." After almost 20 years and spending around 50,000 hours on screens trying hundreds of books, watching thousands of videos, and crossing roads online with tons of other traders and chatting with them, I realized one thing quickly: "I want to find a trading concept and edge that will be as simple as possible, that I will be able to trade from my phone or on the go whenever I feel like". Years were going by, money was wasted, frustration and sadness grew, and I kept going and trying. Ten plus years ago, I came across the concepts of legs, momentum, progression, support, resistance, and loss/gain. Mid time, I also studied for years Wyckoff accumulation and distribution mythology. Months and years were going by. I crossed my roads with people that were supposed to be "OG’s" of the concept. Time goes by, and even though I spent time with some traders and spent lots of time on chats, video calls, etc., none explained me, as I see now. Maybe they knew and didn’t want to share, or they were still fishing and didn’t really know what they were talking about and/or feeding own egos, or I was too stupid. Finally, one day I crossed my eyes with a Quasimodo pattern, and I could not be any more happy about it bc stuff started clicking more and more, eyes start catching the setups and probabilities, but the struggle was still with execution. Execution in trading is the biggest mental game each trader will ever face in life. You deal with fear of missing out, losing your hard-earned savings, greed, bias, you name it. They designed this game to test the strongest to the maximum, and only the most discipline and patience can ever make it in this craft. Nobody imo can teach us trading, and nobody imo can teach us execution. People can try to guide you in the direction of the good edge they figure out, but only if you are lucky to find someone like that in life, In the end, it will all come down to each individual to put time on screens, learn discipline and patience on their own, and then, if it works, rinse and repeat.
There are tons of "mentorship" books and services out there, but sadly, the majority is garbage, especially when it comes to social services, because they are trying to charge thousands for the bullshit for their own gain. In reality, they didn’t achieve much in life, so they are trying to sell the illusion that they will teach someone how to trade to make a ton," while at the same time feeding their own egos and pockets at other people cost. Well, forget about all that because I wasted years of my life around some. You can pick up small things in chat rooms, on Twitter, or on other social media, but nothing will beat your time spent in peace on screens watching one or two instruments over and over on multiple timeframes for you to spot the same or similar sets up over and over again to build your own edge.
As I mentioned above, my lifetime goal in trading was to learn the concept that I would be able to execute anywhere and anytime on my phone without being stuck to screens as I used to be. The simplicity of QUASIMODO PATTERN truly changed it all for me, with my own spin on it, of course. As mentioned, there are many ways to find their own edge, but most of them will require traders to watch charts and/or DOM or follow some indicators. Either they will trade market profiles, order flow, bookmaps, TPOs, trendlines, etc etc. they will have to be checking/looking screens a lot. The screens definitely can help, but in the end, the supply-demand, legs-progression concept is no longer needed to be glued to them. It is based mostly on one set-up, with the ability to fit multiple timeframes with larger legs. For many will take time for them eyes to catch as much of it, some will give up and some with time will success.
I will try to share a little/basic of that concept with some examples, which hopefully will help some traders and save them some time.
LEGS * MOMENTUM * PROGRESSION
LEGS…
Legs are the easy part for most to spot because the concept is pretty easy. Most will take peaks (heights) or valleys (lows) and mark them, and you already have "legs.". You go up and will find resistance, or you go down and will find support. “Easy”, right ? haha. sure ...
BUT IS NOT ABOUT THAT HIGH OR LOW.
WHAT MATTERS IS WHAT LOW GAINED THAT GAVE THAT LOW OR WHAT THE HIGH LOST THAT GAVE THAT HIGH, THAN THEY CREATE SUPPORT (UNTESTED DEMAND) OR RESSITANCE (UNTESTED SUPPLY). WHAT IS UNTESTED SHOULD NOT GET BYPASS WITHOUT REACTION ON THE FIRST TEST THAT CAN COME RIGHT AWAY OR WAY IN FUTURE UP TO THE TIEMFRAME. I will talk more about it below soon.
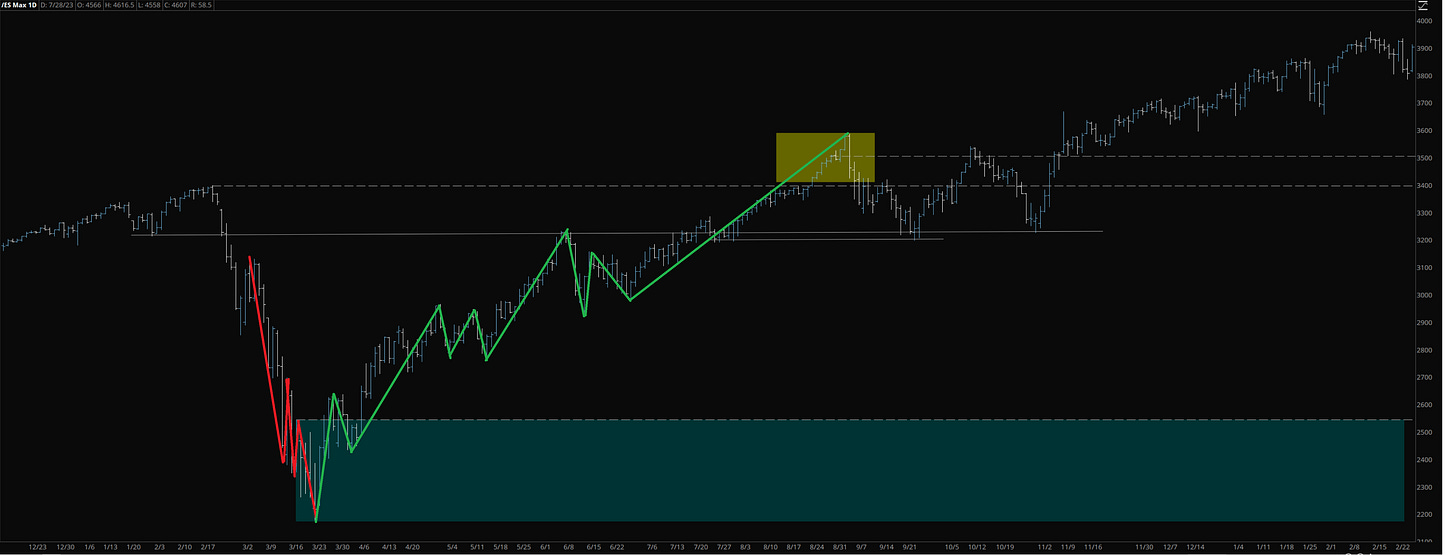
We deal with different legs daily because every timeframe will have its own legs, but understanding legs and progression is the key. Let's say, looking at the daily or weekly timeframe, we will be dealing with 3 legs. The 1st leg is the current move we are in; the 2nd leg is the primary leg, and the 3rd leg is the biggest leg to the left of the 2nd. "You must fit your current move (1st leg) with the move from ATH (2nd), and with the move to ATH (3rd), that’s usually the largest or longest leg your eye will spot on the chart." I won't be talking much about fitting the legs, only posting a few screenshots about it, because what’s most important is to understand what is gained and lost and concentrate on the first leg and progression because that is the most important key element. Fitting legs on a higher timeframes is done by putting together the concept of "loss/gain" that will be explained soon in a few steps from leg 1 and the progression of each timeframe (usually higher tfs) with the reminding of two legs, making the zones or levels where they should be retraced, and going back to square one to watch that zone to spot with eyes the same set up to create the new leg all over again.
Let’s start with the most basic main legs that anyone can see atm. I used Daily timeframe to point out tad more details than if would use weekly timeframe that is KING of all timeframes btw.
yellow - 1st - current , red - 2nd primary leg, 3rd - the biggest leg to the left
Inside that main 3 legs we have many smaller legs that were playing progression and when we will understand what actually is loss/gained (explained that well detailed below so come back later to this if so and may be will make tad more sense)
So now I tried my best with color-coding how to fit the moves between all the legs, and we see that even though I did the best I could do, it can get a vision tunnel. This is so much easier to explain in an hourly video, but I am not planning on making videos. I should highlight some points, but it will just make this screenshot way overcrowded, plus I will be spending more time below in Part 2 of Legs, than Momentum, and Progression to explain a better basic concept that is more than enough to play day-by-day basic imo. In the progression below, I will explain some stuff that should make more sense. I just can't connect every pop or drop between legs because it's simply impossible to do it on one screenshot.
LEGS part 2 …
SUPPORT/RESISTANCE LOSS/GAINED …
This part I might spend the most time with the examples, this is the Basic what actually is loss or gained. How we identify gained , how we identify loss, how identify and play created untested zones / legs start etc.
This part of this post of mine imo will be the most important, bc everything is running around it, follow by explanation in progression part.
The most similar to this concept we can compare is simple “2B Sell / top reversal & 2B buy / bottom reversal” set ups with higher heights (HH) higher lows (HL) and lower heights (LH) lower lows (LL) patterns…
Anyone can find bunch of 2B stuff online these day of that pattern and many other patterns online, especially from Legendary pattern trader Mr. Bulkowski (here) who has several amazing books that are very worth to read or Suri Duddella with one of best ABCD chart patterns book “Trade Chart Patterns Like a Pros” out there (here).
That last examples are classic “Dow Theory” that anyone can google up and find bunch of stuff online for free to dig deeper into it if interested and/or not familiar with.
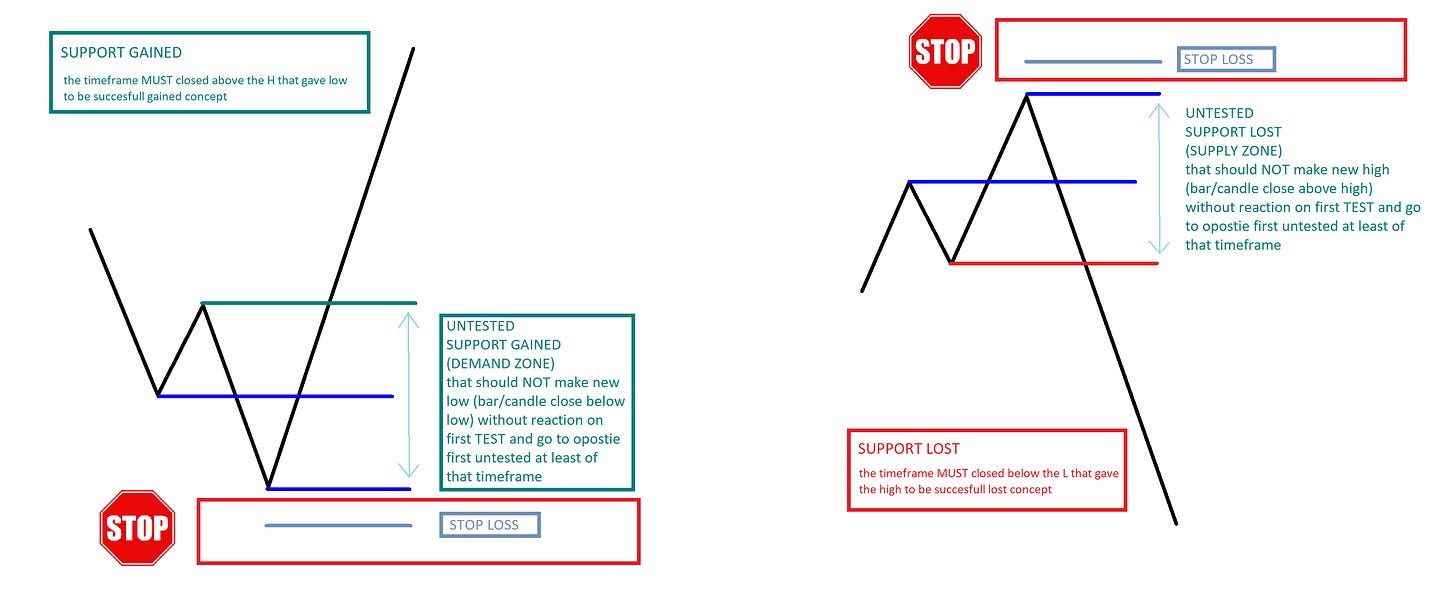
NOW, the main difference of concept my eyes spot over the years to it how we close the bars/candles. As I mention above in part 1 of Legs “WHAT MATTERS IS WHAT LOW GAINED THAT GAVE THAT LOW OR WHAT THE HIGH LOST THAT GAVE THAT HIGH, THAN THEY CREATE SUPPORT (UNTESTED DEMAND) OR RESSITANCE (UNTESTED SUPPLY). WHAT IS UNTESTED SHOULD NOT GET BYPASS WITHOUT REACTION ON THE FIRST TEST THAT CAN COME RIGHT AWAY OR WAY IN FUTURE UP TO THE TIEMFRAME.” the candle/bar to properly gain or loose MUST close above of the move that gave the low or MUST close below the move that gave the high. That’s what makes the biggest difference, imo using quasimodo pattern.
This is ONLY first simple graph / basic setup that I will be expending more with examples from here and later in momentum showing in wider consolidations, accumulations, distributions etc and in progression where/how to target and what. But this as simple as is, is the main basic for moving forward.
So what happened after this gain or loss? What happened is that the moment we closed the bar above or below, we created untested demand= support, or supply=resistance, aka LEG START. There is lots of stuff online about trading supply and demand, the whole market, and basically every business aspect is based on supply and demand. One good trader out there in S/D trading is Sam Seiden; you can find his publications here too.
So most will ask what the precise level is after gained or loss. Well, I stopped caring less about precise level to ticks long ago, because the moment we gain or lose the WHOLE zone from the L to gain and from the H to loss became gained or loss, so support or resistance zone(s).
Some will ask quickly when we will test these untested zones. Well, it is up to the timeframe, and there is no answer to it. The key for me is to spot quick gain and loss set ups, and know where I’m on each of the following timeframes in the progression and what/how to targe= exits (will talk about it in the progression part).
Examples of testing... Tests can happen quickly in a matter of minutes or hours, but they can happen over days, weeks, or many months ( especially if comes to weekly tf). On higher timeframes, we are going to leave gain or loss zones that can stay untested for ages. Again, the key is to spot them. Usually, it depends on how wide the zone of the gain or loss is that I’m acting or not on entries. In high volatility like we had last year, it is better to size down because the zones can be on M15, even 50+ points. We can always zoom in to lower TF to look for more precision too. In smaller volatility, usually zones are "joke" 10–20 points on M15 if so, sometimes they can be even less. So my entry can start right away after the bar closes above or below the set up, especially if there is above-gained or below-loss tested in advance, and if there is near by untested zone, I know they will react and come back to test what they gain or lose.
Basically, this whole simple concept is based on simple QUASIMODO PATTERN applied to each tf. Feel free too google up for more info bc is out there for ages .
So now let's find real examples on ES for different timeframes of successful and unsuccessful gain and loss set-ups.
This is random M15 support gained (yellow mark) gained move to low backtest later and send it, there is also loss on that screenshots too but wanted to concentrate on gained first.
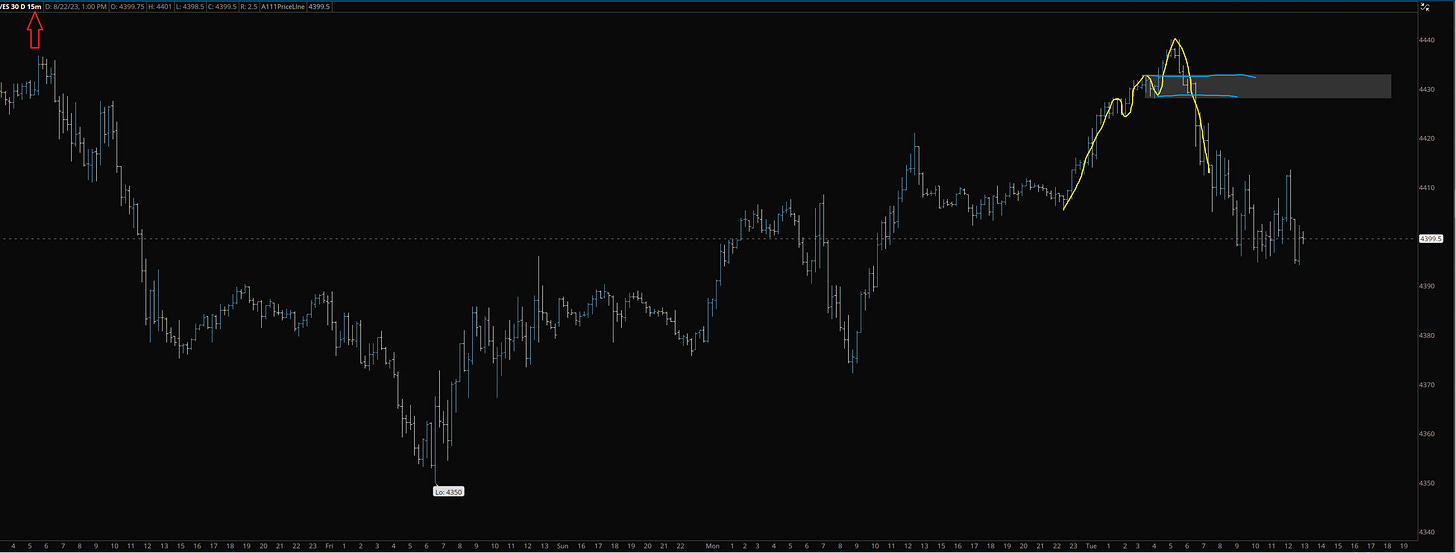
On this M15 example we have first unsuccessful loss, sellers could lose support, price made new H for liquidity, trapped and lost support after. hours later we continue to testing demand and found support at it.
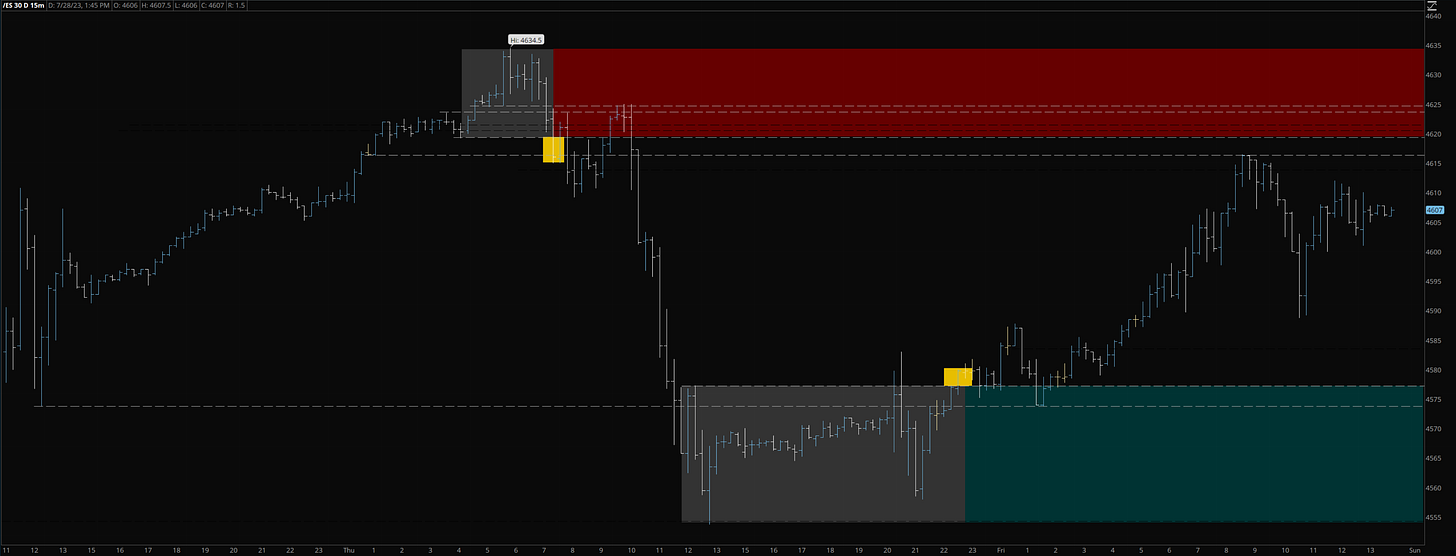
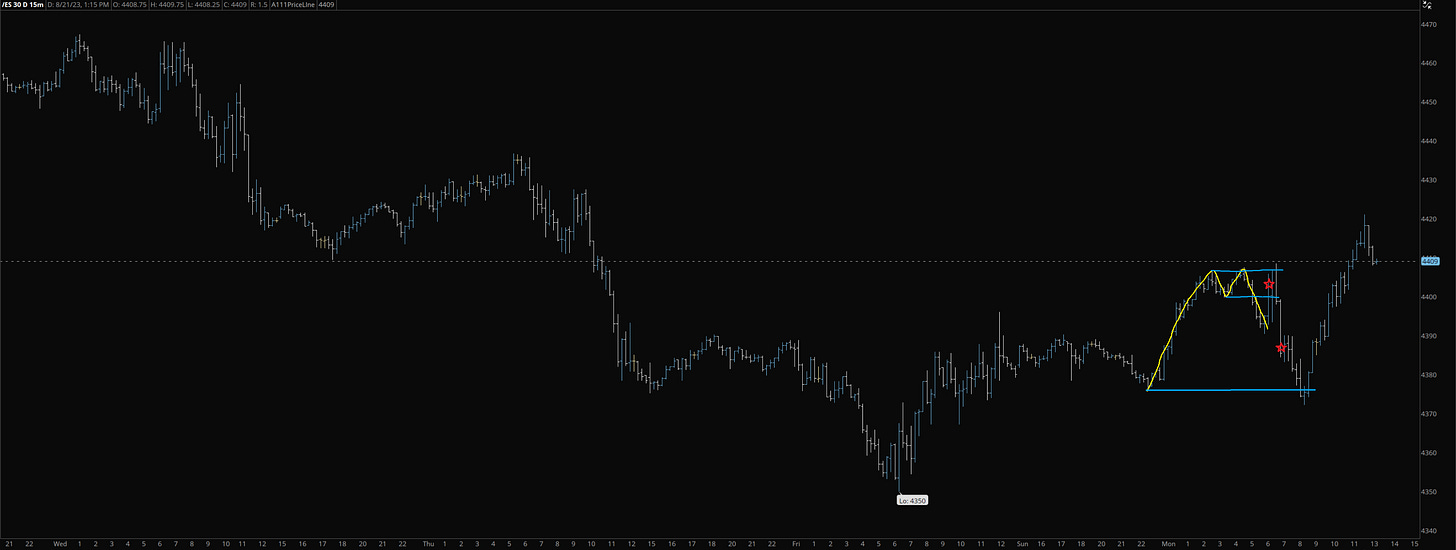
Another example of both gained and loss recently on M15 … that’s 100+ pts moves in 24h window base on two set ups of of recent PA. We had perfect loss, back test and drop, we had later as good example failed gain bc timeframe never closed above the move that gave the low, than fail to make a new low and tried again and succeed to gain, back test and send it.
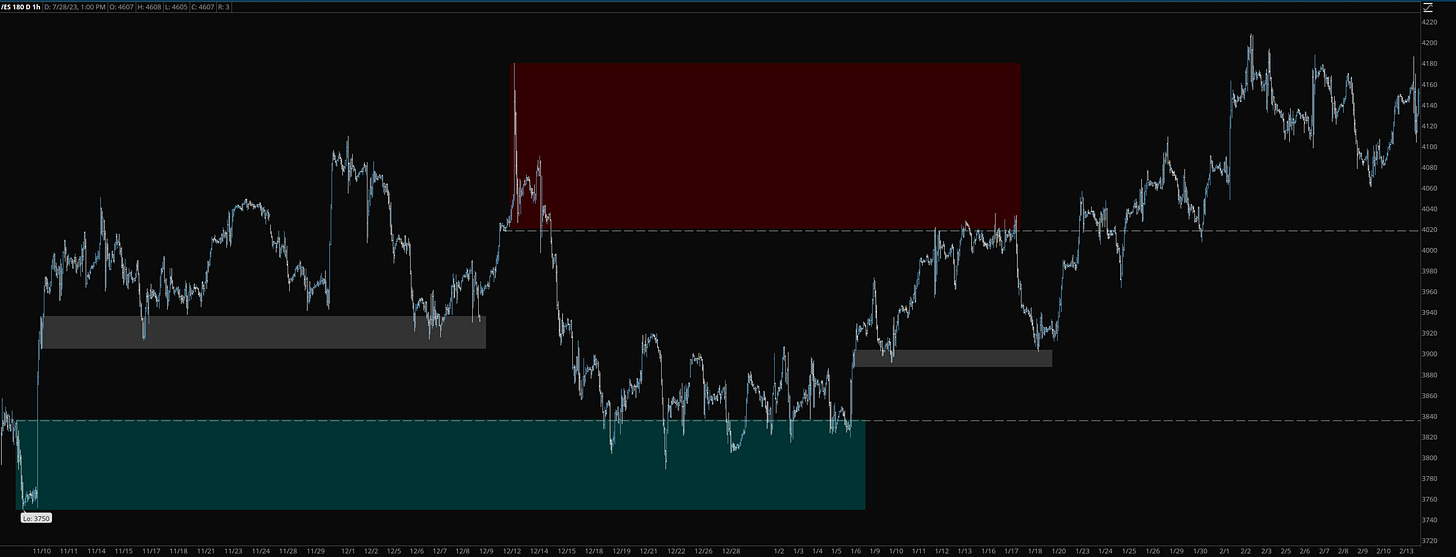
Here is high volatility random time 1h tf, both gain and loss set ups. There were other progression plays between too, but for this example, it is to show that we didn’t test or backtest right away and we did days later, since they left untested as soon as we came back to gain untested support, they sideways consolidated/accumulated and sent it. Even though they sent it with time, when they made it to the loss untested zone they left, they had to smack to test demand, and only after that they could send it again and continue higher.
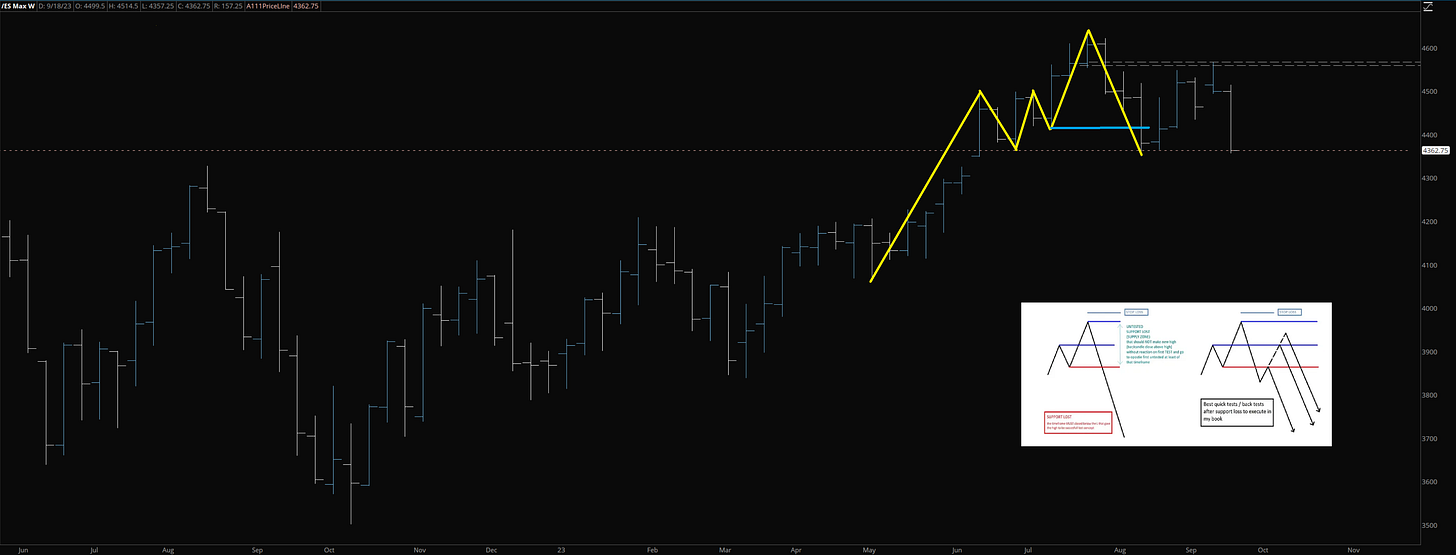
Now will make little eyes open for readers and do big examples weekly. During the COVID dump into COVID lows, the recovery on weekly didn’t gain until months later and tons of points later, but that’s ok because we can zoom in on daily to get more precise in a few. First, consider where we obtained last year's lows ... from what we gained on weekly. We made the low last year in October from the gain from September 2020, then gained on weekly again, backtest, consolidate, and send it. We have a weekly supply that should produce a backtest to first demand at least, and it will be up to how the backtest performs if we get deeper pb or after the backtest we continue higher in the coming weeks or months. Currently pullback down to 4410s-4380s would still keep up progression on weekly. It would produce loss on daily and later give more stuff to play but weekly would be intact.
So when we zoom in into Daily of the Covid low , what we have? we have our good support gained set up AGAIN ;) You can see the momentum slowing down on the Daily before Covid low.
One more example I want to share is fake/sweep low on Daily... and done with the examples for now because they take time. I will try to post some of them from time to time in daily posts and some attached to this post with time too, to build even bigger info. It's the same chart just posted above of Weekly, but zoom into Daily of last year's October lows. On weekly, they gained, as the yellow square shows, but on daily, we had gained earlier, and that gain was respected too. What they did was very vicus by sweeping the low by 60+ pts, hitting the demand, and sending the same day, never closing below low what was gained. Is not the first time on yuge volatility to do so. I will talk some more in momentum part about it. Its call simple liquidity.
Never forget: The market can only do one of two things: make new highs or lows or test what was lost or gained … but also should NOT bypass what’s is UNTESTED if identify correctly. AND CLOSES OF THE BAR/CANDLE ARE EXTREMLY IMPORTANT.
MOMENTUM …
They say trend is your friend, sure, but we are not going to have trend day if the chart is not set up for it. Either on the way up or down on opposite side of the current move we are in, they have to test it in advance for us to bypass. If they wont set up the chart in advance, we won’t see any trend day or multi day / weeks trend up to the timeframe. We would instead get consolidations that are either re-accumulation or re-distribution up to direction, so-called "chops"to suck/slow momentum, or simple accumulations or distributions. The longer the timeframe, the longer it takes, and the shorter the timeframe, the faster it takes. The best trend days we get when we have ahead of us tested levels so they can bypass and several timeframes are in sync with the same progression direction. Overall, many don’t realize or know that a real "trend day" on ES_F happens only around 10% of the time because, 90% or so of the time, ES won't close above or below 1.3s% for a day. When we would drive a car at 100 mph, we wouldn’t be able to do a U-turn right away, or, simply, you would do donuts and probably die. We must slow down to do that U-turn. Same in trading, when we have strong momentum and are coming to a final retrace zone of supply or demand, prior to that, we usually get breaks applied to either start accumulation, distribution, or consolidation, what most call "chops".
Again, there is many patterns that can show us momentum, either slowing down to reverse after or to re accumulate/ re distribute or accumulate or distribute. BUT in end AGAIN it will come to the same set up of “gained support” or “support loss”. I will try share few examples of that.
FALLING AND RISING WEDGE
As we see, this is a slowing momentum pattern, but in the end, we will end up with the support gained or support lost concept, as explained above ... all comes to the same set up... Is that simple ! Falling and rising wedge patterns are one of the most popular patterns, they repeat over and over and over again, so don’t think we need examples on that since follow LL LH LL LH LL LH till will make first HH follow by HL.. oh, darn, it is the concept SETUP in KISS ;) same other direction HH HL HH HL HH HL till first LL follow by backtest of LH and bye. That pattern slows down your momentum, so you can do that "U-turn" when driving 100mph ;) AGAIN CLOSES OF THE BAR/CANDLE ARE EXTREMLY IMPORTANT.
CONSOLIDATION
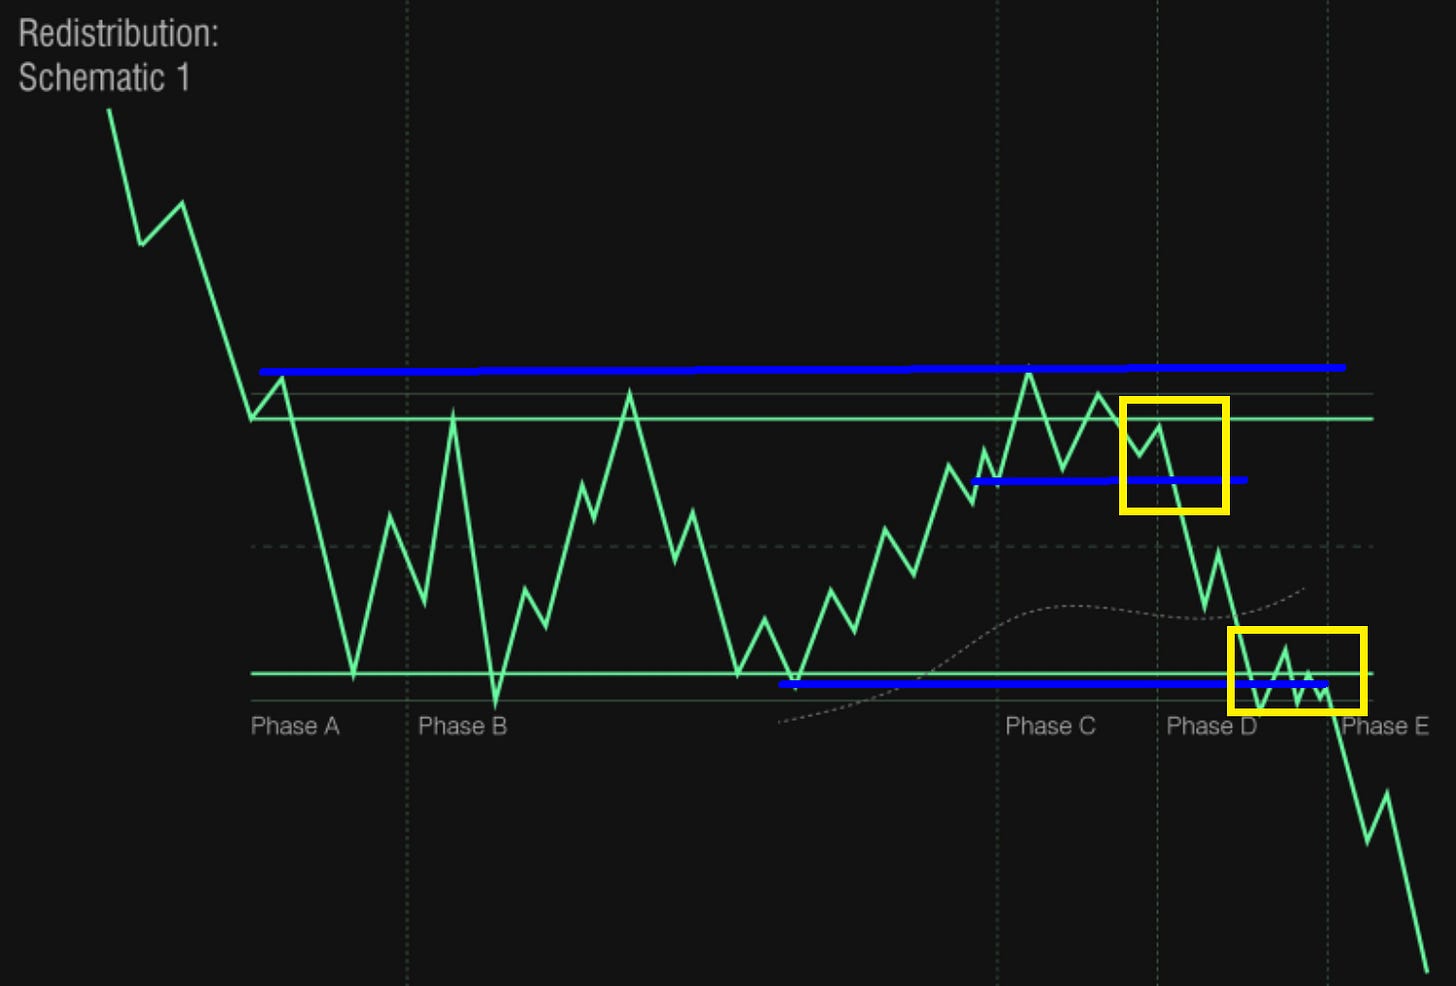
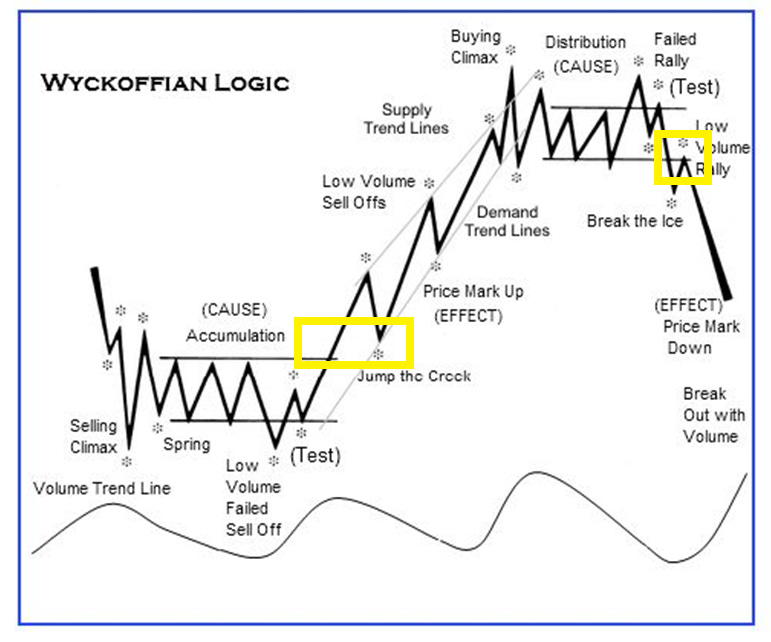
That’s mostly re-accumulation or re-distribution base on direction. I used to study lots of Wyckoff stuff, there is tons of good books about it so feel free to check online, can start (here) too. He has several patterns /schematics either for Accu or Distro or “re-A/D”.
Its pause in trend, ownership strengthened, cause builds for a new uptrend. In end will come again to same set up tho, It can’t loose support, and need to make in end new H, close the bar/candle above do/or not small back test and send it.
Same thing with re-distribution …
ACCUMULATION & DISTRIBUTION
Wyckoff whole logic no matter how we look at what patterns, it will come to same basic set up of gained and loss support … its really that simple ! ;)
Either we will call “support gained or support loss” vs Wyckoff “Throwback” is the same shit ! ;)
Same with Distribution .. either we call “support loss” vs “LPSY” is the same shit! :)
And last same with Accumulation … we call “support gained” vs “LPS” is the same shit ! ;)
So as we see in end for any of the patterns and or momentum schematics we come to the same BASIC SETUP.
Never forget: The market can only do one of two things: make new highs or lows or test what was lost or gained … but also should NOT bypass what’s is UNTESTED if identify correctly. AND CLOSES OF THE BAR/CANDLE ARE EXTREMLY IMPORTANT.
PROGRESSION …
Imo progression is a key element of the whole game. Each timeframe has its own progression. We can have all timeframes sync in an up-or-down progression, or we can have timeframes mix in opposite progressions. That’s when the best volatility comes in. It is extremely important to understand where we are on the next timeframe and where each next timeframe progression is at. Where is each timeframe supply-resistance or demand-support, and if it is tested or untested? Untested shouldn't bypass, you should get at least a reaction to the opposite resistance or support first. Progression is movement, from going from an untested zone to the opposite on the same timeframe, and we need to know where we are in the next timeframe. For many people, it can be complex, but it really is not. Lower timeframes can change progression several times in the day, but weekly might be in the same progression for many months, daily for many weeks or months even too. I trade Weekly Daily 4h 1h m15 timeframes only and for scalping 1600t if so (its similar to 5m, I just found it cleaner for my eyes). Since, on a weekly or daily basis, I know where I am, there is no need to look often. I spent the most time on the m15 and 1h timeframes. M15 is giving several times per week fantastic set-ups to trade with hourly. Each of the loss/gain is flip of the progression and can be spot in seconds by looking at the chart on the phone. THIS IS THE BEAUTY OF THIS CONCEPT AND HOW THE MARKET ACTUALLY WORKS … imo.
So since every time frame is in its own progression, when does it start and when does it end? Well is beyond simple, progression starts the moment we gain support or lose it and ends per timeframe the moment we gain support or lose it per direction. So let's say we gain on M15 that timeframe automatically starts "up progression" and won't flip to "down progression" till we have success support loss on that tf. Will repeat again, that being said, every timeframe has its own progression. We can be "bullish or bearish" on higher timeframes for months, but mid-time (4h 1h, M15, etc.) will be playing several times opposite progression because that’s how they set up future moves, accumulating, distributing , consolidating, etc and that’s how they create liquidity. So I'm going to repeat again that it is a MUST to understand where each timeframe is in its own progression and where each timeframe has the next untested zone.
All the macroeconomics, fundamentals, and news mean nothing these days. That’s why people are so frustrated many times because "macro/fundamentals" can be bad but markets or stocks go higher, or "macro/fundamentals" can be good but the market or stock will be in correction. EVERYTHING IS IN CHARTS, all the news that is coming is already priced in or set up in advance, during news releases, they just accelerate moves or trap people since they set up moves for the "news release" well in advance. I check news calendar weekly but only to see at when/what time I can expect volatility if so that I love. So our job is to try our best to read the charts and execute what’s in front of them. Execution is the hardest part for each trader, but I will talk a little about it later below.
Lets bring few examples … the closest concept to compare to it is higher high, higher low, lower high, lower low with applying the basic set up.
Random 4h spot on ES
Since we gained from that low there, they test what was untested in Zone 1 and came back to test what’s untested after they gained, "TEXTBOOK". Since Zone 1 was tested on 4 hours, they could technically go to the next UNTESTED zone of that tf, which was in Zone 2, and that zone since it was untested couldn't be bypassed, the untested zone needs a reaction at least and it got and is sold off as should. So if long from the backtest, best in my book on that timeframe of this example is to still target core in Zone 1 (bc safety first) and keep the partial to zone 2.
Here is random M15 on ES
Again, same set up, we gained, they backtest beautifully and send it, the red "x" means that they were testing on the way down and preparing to send in advance, so what should be a target? , the next untested we can find and/or till we lose something. And no matter if Daily or Weekly is in up progression , if we have untested, we should at least get reaction to backtest first S/R opposite, and they respected that of course.
So right now we have to put timeframes together and know where are we on the next timeframe. So same spot but we checking on 1h what is going on (4h many times might be similar). So as we just saw above the gain on M15 and target base on M15 progression, we looking next tf that is 1h (always remember where we are on 4h Daily and Weekly next too of course). And 1h we got the gain of course too, BUT the loss on the way down that was untested on M15 as a zone was tested on 1h setup loss (bc level to loose there was different) on the way down so technically could bypass on 1h but that M15 had untested so had to give reaction at least and it did and where we continue? to the 1h left UNTESTED, they did that on this example what I call “vicus” double top btw by sweeping the high by few ticks, but 1h never closed above the H and untested was respected as should, this is very good example. They left Untested 4380s zone btw for future.
Last one current ES progression on Daily tf as writing this post …
and weekly ES …
Making these examples takes time compared to writing so enough for now;). That’s why I made a section below that will be adding something from time to time to build more examples in the future on different timeframes and may be from time to time, attach some examples to daily probabilities outlook or at least weekly probabilities outlook. But all around comes to same basic set up and applied to each time frame and fit between legs, just to understand what you must lose or gain. Since I dont have to look Daily or Weekly at all except once in a while if so to remind myself bc we have one level on each timeframe to memorize so from day to day, I can trade/ watch/or check 2-3 timeframes only. It’s beauty !
IS THE MOST SIMPLE CONCEPT I MY EYES COULD CATCH IN MY LIFETIME, AND I THANK GOD FOR IT A LOT.
IS ALSO A PROVE THAT SIMPLE WORKS THE BEST so no matter what you up to in trading concepts KEEP IT SIMPLE.
Never forget: The market can only do one of two things: make new highs or lows or test what was lost or gained … but also should NOT bypass what’s is UNTESTED if identify correctly. AND CLOSES OF THE BAR/CANDLE ARE EXTREMLY IMPORTANT.
EXECUTION & PSYCHOLOGY
aka “MENTAL MASTURBATION”
Psychology is a critical part of trading. During each trader's journey, the biggest enemy is its own mind. As mentioned earlier, we are dealing with machines that they spent billions on to create algorithms, etc. that have zero feelings. As humans, we deal with our own emotions. Either greed, fear of missing trades, fear of trying to be right/ego and beat the market, or any outside bias that gets to our heads, or general fear of losing money and letting losing trades affect your judgment, there are plenty of them. Most traders, at some point in their journey, will be dealing with some kind of depression, feeling like they are looser because they can't get the sh*t right, some financial problems, and some will even bring problems into family life, sadly. This is one of the toughest spaces on earth for success, imo, but the rewards if you make it through it are limitless. We can learn with time how to read charts or find our own edge ... that's the "easy" part, but for the rest of traders lives, we will keep working on execution and mental aspects. Even though I have done that for a very long time and I mostly "master" reading charts / found my edge, I still make stupid mistakes, like getting into trade too early or putting myself in drawdowns that I know I could limit even more, but this is a whole life improvement game, and year after year for the rest of my life, I simply get better and better. In the past, I used to blame everyone around me but not me. I blamed that market is ridged, that I can beat the whole market, looking for news, others putting bias on my head, even darn weather haha. By now, when I screw up, I know that is mostly my fault. The best setups can fail, but there is a rule to the set-up, and if I follow that rule, stop loss is part of the game, but if I fail to follow the rules, it means I failed, not that market is ridged. I don’t blame anyone else for a long time if that happens. It's all in charts, and either I failed to read the chart correctly or I failed to execute it correctly, period.
In the concept that I trade and explained most of it above, the rule is very simple. Take the set-up of support loss or gain. If long, that stop should be below low (timeframe bar/candle close, or if hard stop than several pts below the low). If short, that stop should be above high (timeframe bar/candle close, or if hard stop than several pts above the high). If the zone is too wide because of volatility or I’m looking at a higher timeframe than simple, I should wait before front running entry of the untested zone and/or zoom into a tad lower timeframe to be more precise and wait for the setup there or if I start front running and filling at beginning of the zone than start small and size down to save as much bullets for later if so.
Do I always respect that? Well, yes and no. Yes on higher tfs Daily and Weekly (except screws ups on some individual stock trades, but never on my main instrument that I trade ES futures. I still front run though and that puts me into drawdowns from time to time (so there will be probably always room for improvements in execution on my end). On lower tfs, let's say on M15, if it goes against me, but I know where I have next untested zone on hourly/4h, I will likely keep it against me, up to how far away it is. So, there is also room for improvement on my end too. Hard stop if not waiting for candle/bar close should be imo up per tf, for M15 around 5-10 pts, for 1h/4h 10-15 pts. The higher the timeframe and front running zones on chart since they getting wider and wider with timeframe size would be good idea to size down imo too.
I don’t believe that any single person can teach us perfect execution or trading psychology. This is a work in progress throughout our lifetime, and each individual will perform according to their own mental discipline. Patience is very hard for many, but the worst is not being disciplined. What helped me personally was when stuff "clicked" for my own trading edge and I grew my own convictions and start to set up orders in advance as soon as I got the setup and just let it play out "set n forget".
LONGER EDUCATIONAL or INFO POSTS:
PATIENCE - SELF DISCIPLINE - POSITION SIZING, and RISK MANAGEMENT are important aspects of consistency in trading (EXECUTION).
In the pinned post Trading METHODOLOGY based on Legs, Support Loss/Gained, Momentum, and Progression (click here) under the EXECUTION & PSYCHOLOGY section, I already mention little about execution and psychology etc., but I wish to make another post more detailed with a good example(s) from this week about patience, discipline, risk management, etc., an…
Big picture for & about BONDS: (ZN_F, ZB_F, UB_F & ETF's: BND, TLT, BSV, LQD & VOO), SILVER (SI_F & SLV), GOLD (GC_F & GLD), DOLLAR ($DXY & UUP)
I was posting about Bonds futures earlier this year on Twitter, but this will be my first Bonds with Gold/Silver/Dollar newsletter post, so let's make it worth it because there should be some good potential swing opportunities coming with time, and I wish to be part of some, at least with etf’s.
For anyone reading this and struggling with the mental part or psychology of this game, I would strongly advise them to read and/or listen to as much possible of the Mark Douglass stuff, legendary person. Just google him up.
All I can tell you in this aspect and overall is GOOD LUCK in your own trading journey !
and … KEEP IT SIMPLE !
EXTRAS
I don’t use any indicators in my trading anymore. I probably tried hundreds of them during my give or take 50,000 hours spent on screens trading journey. As I said earlier, over the years, I have developed some extra mathematical probabilities, but as I also said, I will keep them to myself and share them with kids one day, if so only. They add a more powerful combo to the main concept and extra convictions. I would like to only share two extra things.
FIBONACCI Extensions
Let's say we are in the new ATH and some will ask what’s next. Well, it is the same basic setup: wait till support gets lost and play timeframe by timeframe, or buy last support till it fails with a hard limit stop loss. One thing to look into in advance is the well-known Fibonacci extensions for potential levels. I used to spend a few years playing with them in the past too. Only use three fibs for the potential new ATH levels if so: 127% and 161.8% / 178.6%. I posted recently (here) one post with Fibonacci 127% extension for stock CMG, so I can share it here as an example.
and from that 127% CMG sold almost 15% … 300 pts
For ES if so I could mark them like this atm if so for some time in future…
That’s all for Fibonacci.
ATR TRAILLING STOP
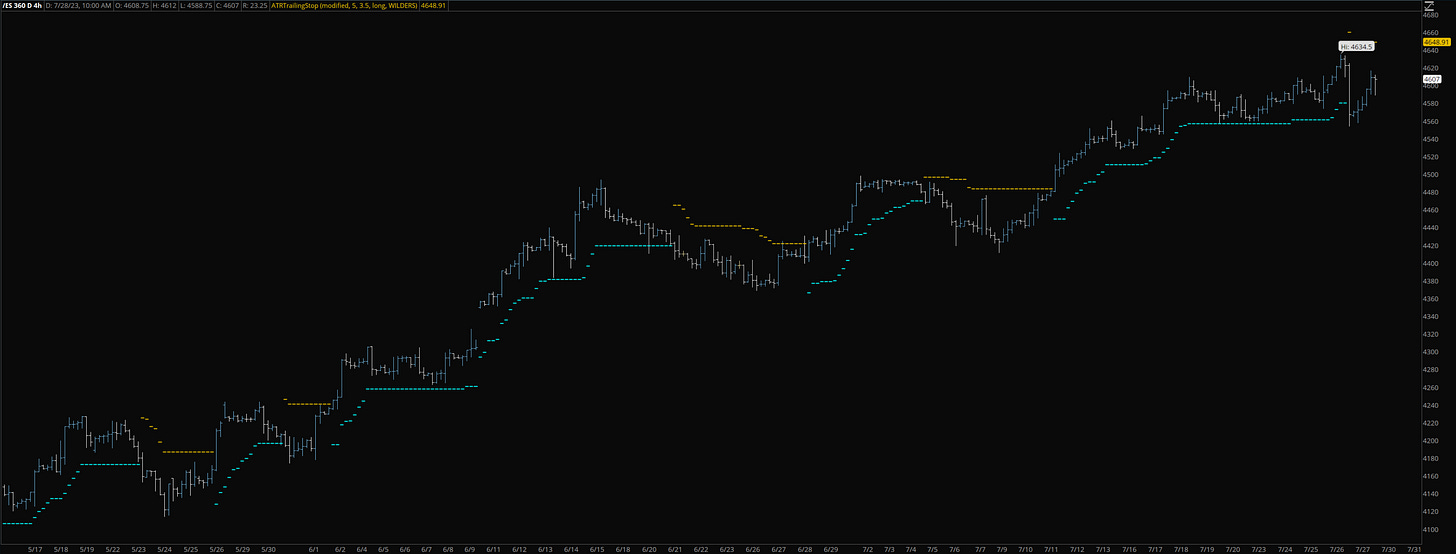
People use all kinds of "curve lines" in trading, either moving averages, Bollinger bands, Vwaps, etc. I don’t like curve lines, and whoever follows me on Twitter has probably seen me say that in the past. But there is one indicator that could be helpful for some: the ATR trailing stop. I have a custom script with my own specific settings, but most platforms have that indicator, and I think Basic can help as is.
ATR Trailing Stop / Average True Range. People use trailing positions, either long or short. If long, ATR is trailing up and stops sitting right below the mark, if short, ATR is trailing down and stops sitting right above the mark. If you spend time, you can develop an extra little edge based on it too. Just play with the settings on it till you find what you think will work best for you. You can find more about it here too.
Here is a basic/default version of Thinkorswim on 4h for example:
I will leave it to each of you to play around and find your own custom settings; if so, that might work out the best. Is not “holly grail” just something I kept around me extra for 10+ years.
EXTRA EXAMPLES (Latest Update10-01-23):
I will be posting from time to time some extra examples of set-ups in this section other than weekly and daily outlook posts.
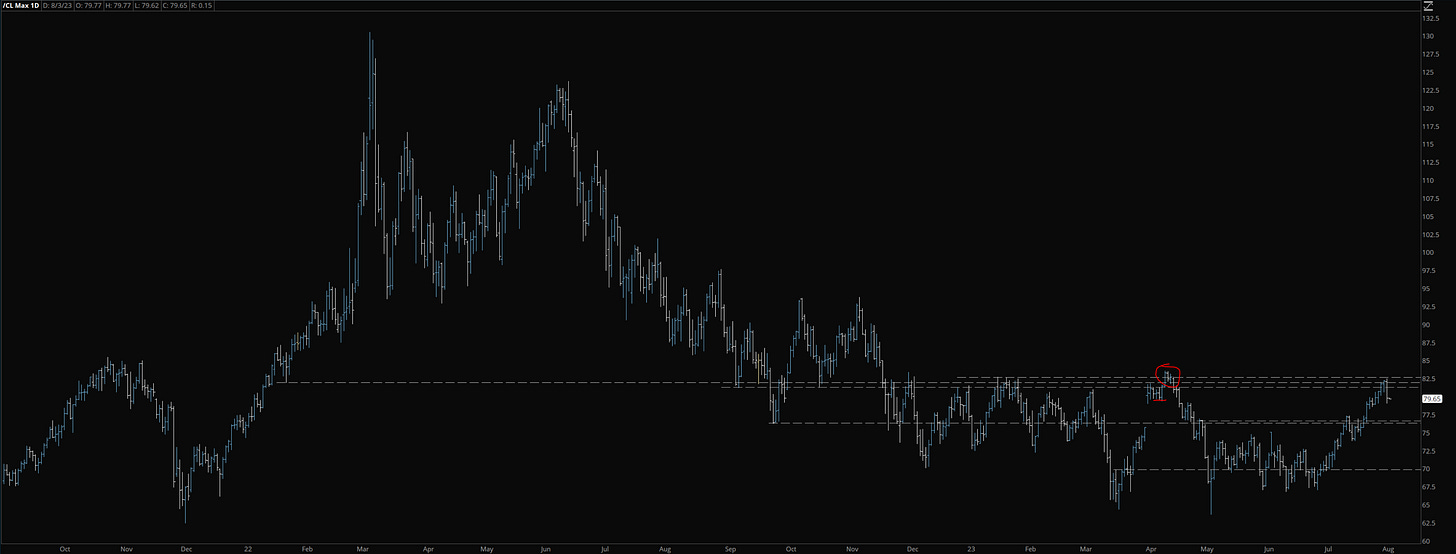
Here is #CL_F example
When we zoom out, we can clearly see Daily supply that was UNTESTED since the loss back in April …
Now, when I mark that supply zone, I can either front-run that 81s/82s to short or I can wait for M15 and/or1h proper set up support loss in the zone. So when we zoom in to M15 we can see perfect M15 support loss set up, later follow by 1h as well (1h btw left untested supply now), so here is M15:
and now 1h that left SUPPLY UNTESTED for future
another example of baby ES_F
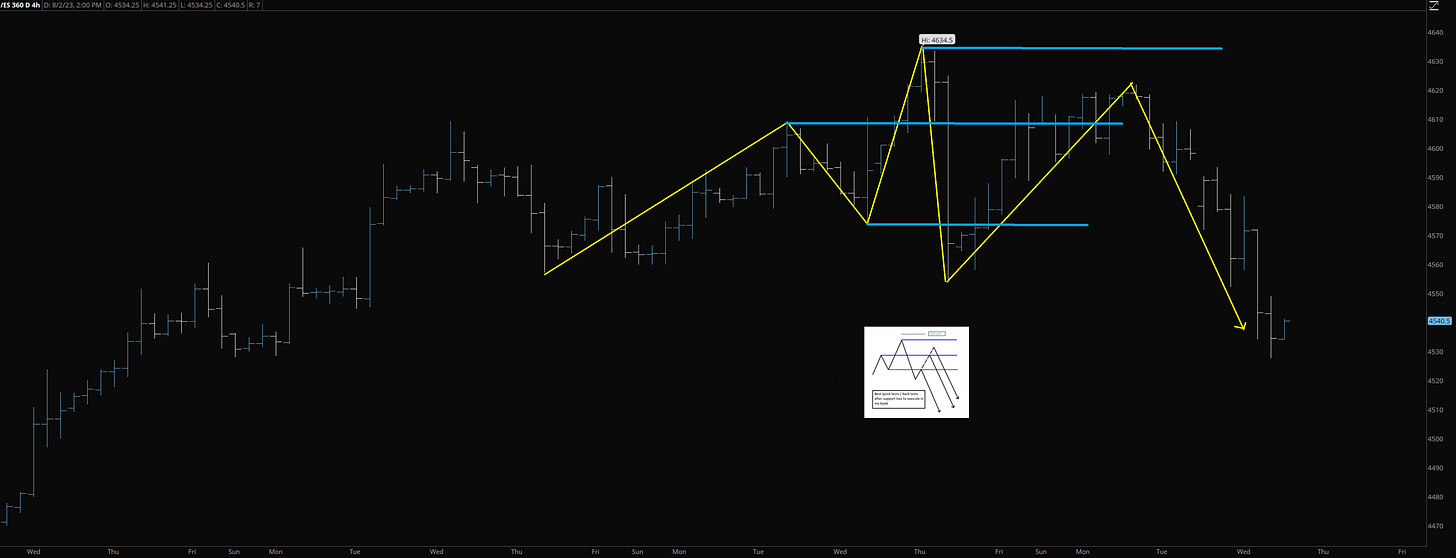
I was talking for days about 4h had loss support set up last week, was short on both accounts, and we finally made it below last week's low per plan.
So atm we have Weekly still progressing up, we have Daily in Demand , and 4h,1h and M15 progressing down; about that will talk more in the Daily post, but here is the 4h set up.
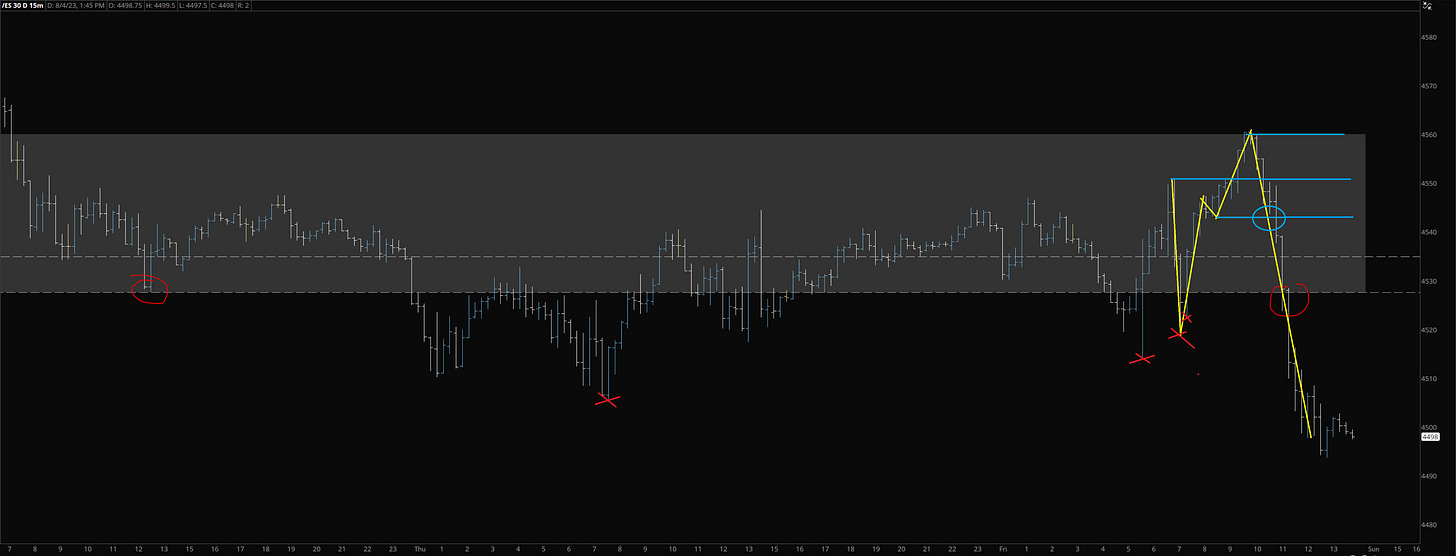
But some can ask now, “nut that zone on the pop after we found support is too wide”, well that’s why we need to work with other timeframes, we go back to M15 now
So that M15 had the loss, we had an extra loss on 1h too that was already in a down progression than never regained, btw, yet what gave her low last week. So if someone who didn’t start shorting based on the 4h concept set up was a loss and did not worry about making a new H bc trusting the process, on the M15 had to chase most likely. I was shorting in advance, based on 4h and waiting 2 days to strike ;). Now since we made a new low below the last week low of that 4h, we must know where we are on the next tf Daily.
So now on Daily we have first loss of support finally, question is if we get backtest than go to 4470s 4420s and may be 4380s with time or we start rolling straight there and leave that zone untested, that’s why bc this is still demand of the Daily that is no joke is good chance we pop from here either to 4560s/70s and or latest untested supply that I marked above at 4610s, so I’m gonna wait for M15 regain support gain set up around here hopefully and get long for the pop that would be backtest.
A new update of examples (on 10-01-2023) with charts Only that were posted in Daily NL posts or on Twitter (the date, what instrument, and what timeframe are shown on the top left corner of each screenshot):
I’m sorry for any typing / grammar mistakes. I born in Europe and English wasn’t my first language ;)
Disclaimer:
Any related materials in the newsletters or posted on Twitter are for educational purposes ONLY. This is NOT financial advice, and the author is NOT a Financial Licenses Professional. Any material shared is not to provide legal, accounting, or financial advisory services, and this is not a solicitation or recommendation to buy or sell any stocks, options, futures, or other financial instruments or investments. Examples that address specific assets, stocks, futures, options, or other financial instrument transactions are for illustrative purposes only and may not represent specific trades or transactions that might have been conducted. This newsletter or anything posted on the Twitter/X site, and any information or training therein, is also not intended as a solicitation for any future relationship, business, or otherwise between the subscribers or participants. No express or implied warranties are being made with respect to these services and products.
All investing and trading in the securities market involves risk. Any decision to place trades in the financial markets, including trading in stock, options, or other financial instruments, is a personal decision that should only be made after thorough research, including a personal risk and financial assessment and the engagement of professional assistance to the extent you believe necessary.
COPYRIGHT © / INTELLECTUAL PROPERTY:
All charts and ideas published here are Copyright © (Substack “@keepitsimplestupidrhino” / and twitter “@Kiss_rhino”)
All content posted by Author on Substack: “keepitsimplestupidrhino.substack.com” and Twitter “twitter.com/KISS_RHINO” is protected by trademark and copyright laws except when Author give permission to share some posts ONLY.
You cannot modify, transmit, sell, transfer, upload etc or create derivative works from. Making unauthorized reproduction, copies of the content may result legal action.























Brother you laid the sauce out on this one. Nice work man
This was really helpful and over the course of the article, your method becomes more clear. One thing I had a question about is if you have a formula for targets. For example for a long, is your target a previous high or multiple highs where you scale out as you reach them?