#ES_F (#SPX) and #NQ_F Charts, Probabilities and Plan (with Video) for Thursday, January 4th
There are significant developments on the NQ daily timeframe, and ES is in a key spot on the daily TF as well. Further details and updates regarding all plus CL are provided below.
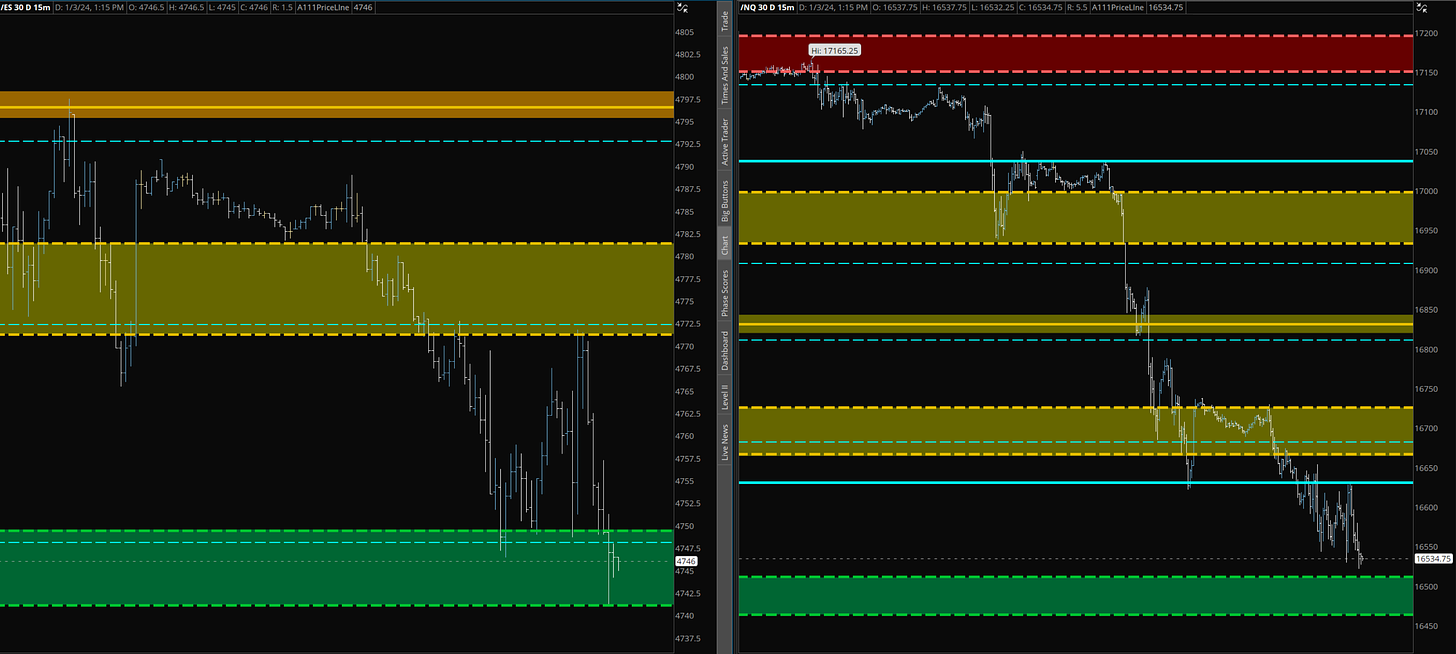
First, here is a chart of ES (Left) & NQ (Right) of how they look today from yesterday's post:
Adding to the positive start to the first week of the new year (all updates are posted before facts or live in chat anyway), levels from yesterday played out precisely again. Here is a quick summary:
I left small runner yesterday on ES that got stopped b/e ON same with small NQ play, so I start my morning flat and fresh.
I was waiting with great patience to make my first trade for the day, and based on 1600t setup, I took my long fill on ES at 4759 with T on half/core of 4771 that came shy. Because of how important the zone was plus my probability support and live PA, including heavy bids that were posted in chat, I left it and added at 4748, and with an average of 4756, I waited a good amount of time to get to the new T of mid-4760s, where I closed all at 4763s/65s for +7-9 pts per contract.
Mid-time, I was looking at oil because it was coming into supply and had been marked since the weekend post. Filled small short order at 73.83 with one more order set higher. Since I keep holding on, more details are below in the video.
Later, I took another trade on ES, short at 4770.50, and closed all per conservative plan at 4758s/56s for +12-14s pts per contract.
All updates are posted before fact or live in chat anyway
🎥 If you are interested in seeing any of the videos from this year's previous posts but have not watched any yet, you may find them all here:
To participate in the newsletter “Chat” conversation (from Jan 1st to paid subscribers only) for any updates during the day or to check the recent or past daily updates in the chat, click here:
Below, I have updated progressions for various timeframes with the current ATR levels per timeframe (on top of the probability charts given below), as well as specific probability levels and zones for ES and NQ for tomorrow, and made an extra video to go over a few things again, especially the daily timeframes for ES and NQ which are very important moving forward.
Here is the new ES_F chart for tomorrow:
Keep reading with a 7-day free trial
Subscribe to RHINO's Substack NewsLetter to keep reading this post and get 7 days of free access to the full post archives.


